Editor’s note: Since this post was first published, percentages cited in the first paragraph have been corrected. (February 7, 1pm)

Following our post on racial and ethnic wealth gaps, here we turn to the distribution of wealth across age groups, focusing on how the picture has changed since the beginning of the pandemic. As of 2019, individuals under 40 years old held just 4.9 percent of total U.S. wealth despite comprising 37 percent of the adult population. Conversely, individuals over age 54 made up a similar share of the population and held 71.6 percent of total wealth. Since 2019, we find a slight narrowing of these wealth disparities across age groups, likely driven by expanded ownership of financial assets among younger Americans.
Data
We use the quarterly Distributional Financial Accounts published by the Board of Governors of the Federal Reserve System. These data combine sectoral balance sheets from the Fed’s Financial Accounts and individual-level data from the Survey of Consumer Finances to estimate wealth holdings by wealth component and demographic group. We examine wealth dynamics from 2019:Q1 through 2023:Q3 for three age groups: 18-39, 40-54, and 55 and over. To calculate real wealth growth, we deflate age group wealth levels in each quarter by the age group-specific price indices developed in the Equitable Growth Indicators series.
Real wealth has increased for all three age groups since 2019, but the change has been most dramatic for younger adults (see chart below). For individuals 39 and younger, wealth increased by 80 percent. In contrast, it grew by only 10 percent for those aged 40-54 and by 30 percent for those 55 and over.
Younger Adults Far Outpace Other Groups in Wealth Growth since the Pandemic
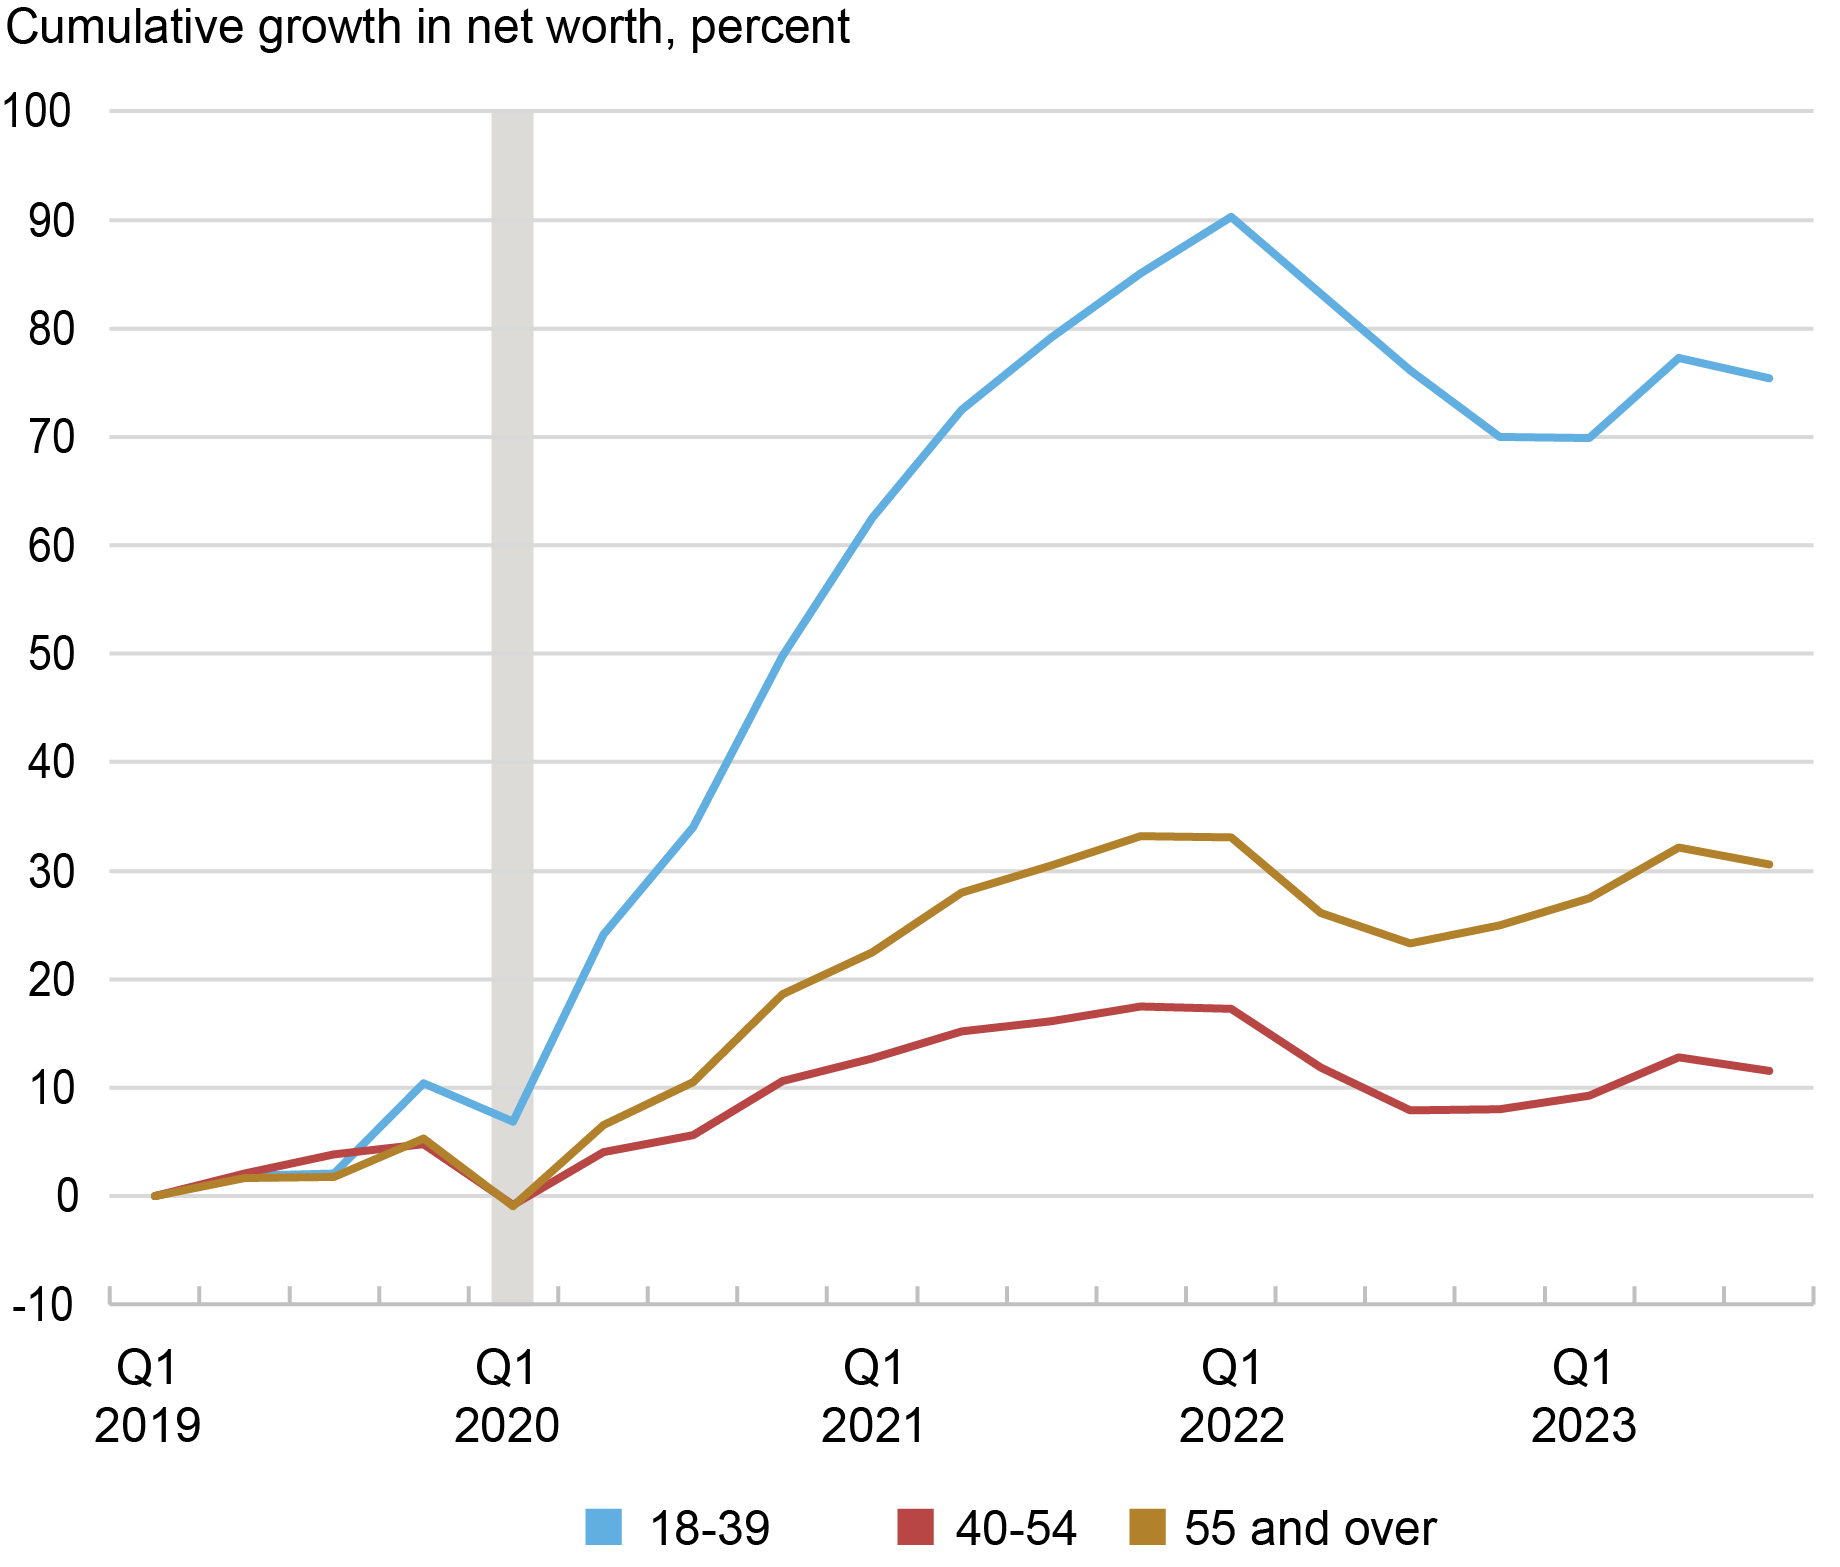
Note: Calculations are based on real (inflation-adjusted) prices.
What accounts for the dispersion in wealth growth over this period? There is very little dispersion in growth of liabilities. The growth rate of liabilities among 40–54-year-olds was only about 5 percentage points higher than those of the other age groups. Real estate assets, which increased by about 40 percent across groups as a result of rising home prices, contribute to but do not fully account for the dispersion in wealth growth (right panel of the chart below).
Financial assets contributed most to the differential growth in wealth over this time (left panel below). Financial asset prices rose through much of the COVID period. Those under 40 saw a greater than 50 percent increase in the real value of their financial assets between 2019 and 2023. Those who were 40-54 saw only a 3 percent increase, while those over 54 saw about a 20 percent increase.
Financial Assets Grow Most Rapidly for Younger Adults while Real Estate Growth Is Relatively Even
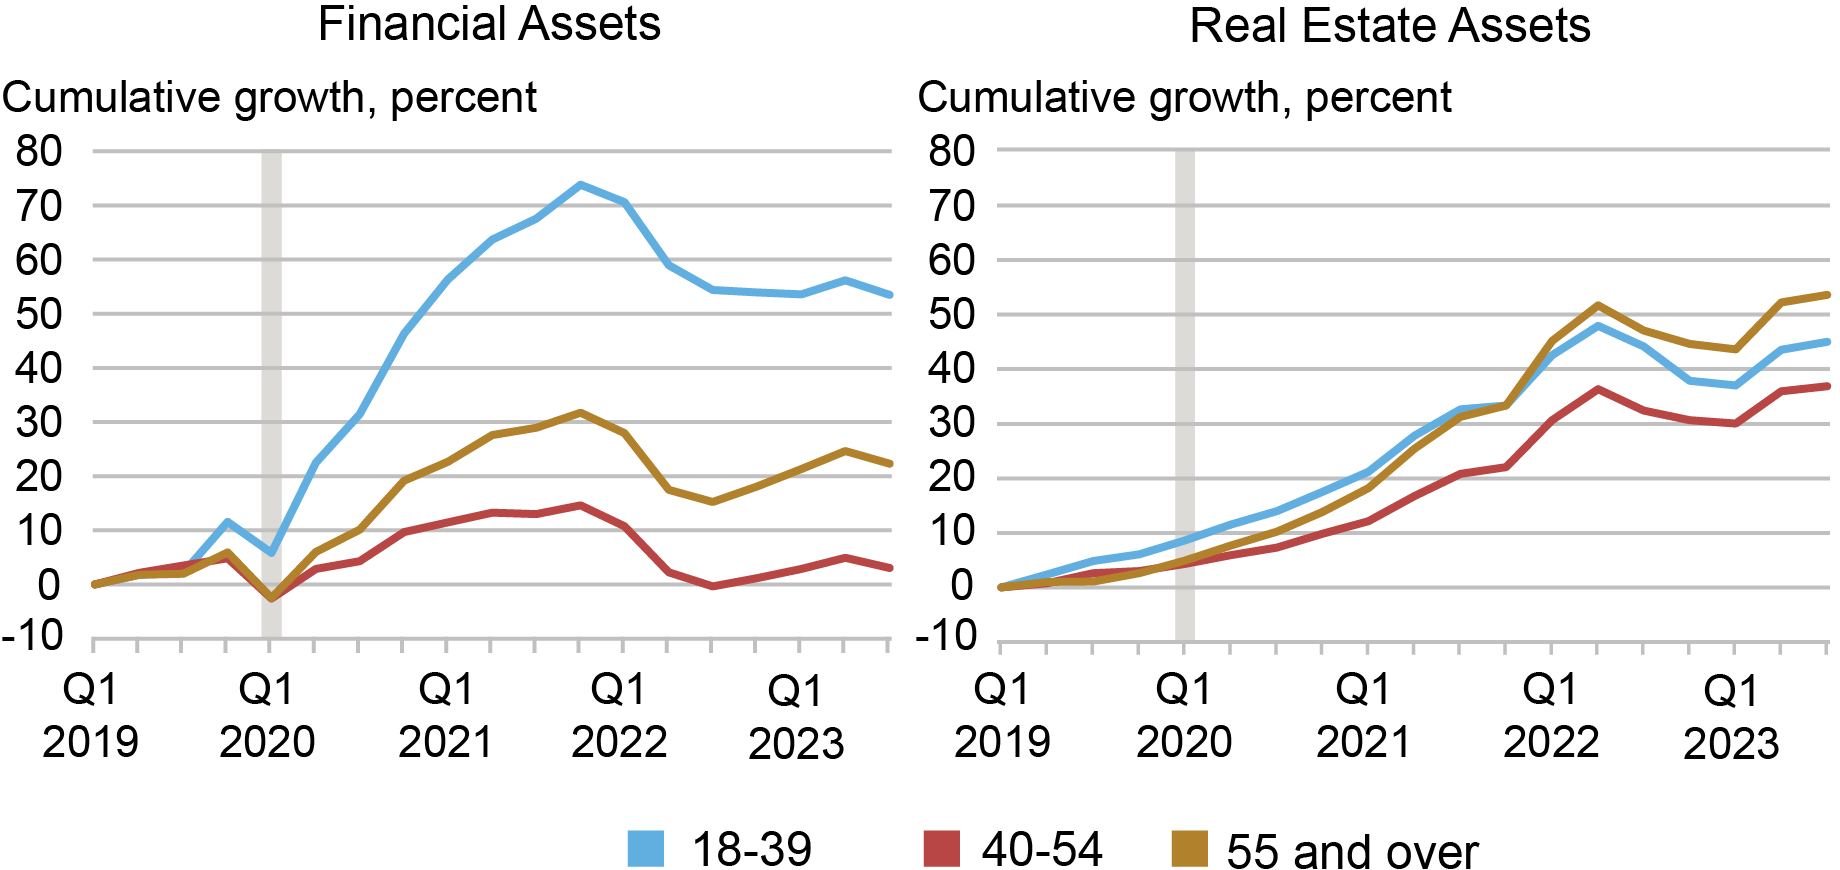
Note: Calculations are based on real (inflation-adjusted) prices.
Financial Asset Composition
To understand this dispersion in wealth, we consider which financial assets each age group held. In 2019, all age groups held 31-32 percent of their financial assets as pensions (figure below). The two younger age groups held about 18 percent of their wealth in business assets, compared to 12 percent among those over 54. The larger differences are in the share held in corporate equities and mutual funds. Those under age 40 held 18 percent of their wealth in equities and funds, compared to 30 and 33 percent for the two older age groups.
Younger Adults Posted Greatest Portfolio Shift toward Equities and Mutual Funds
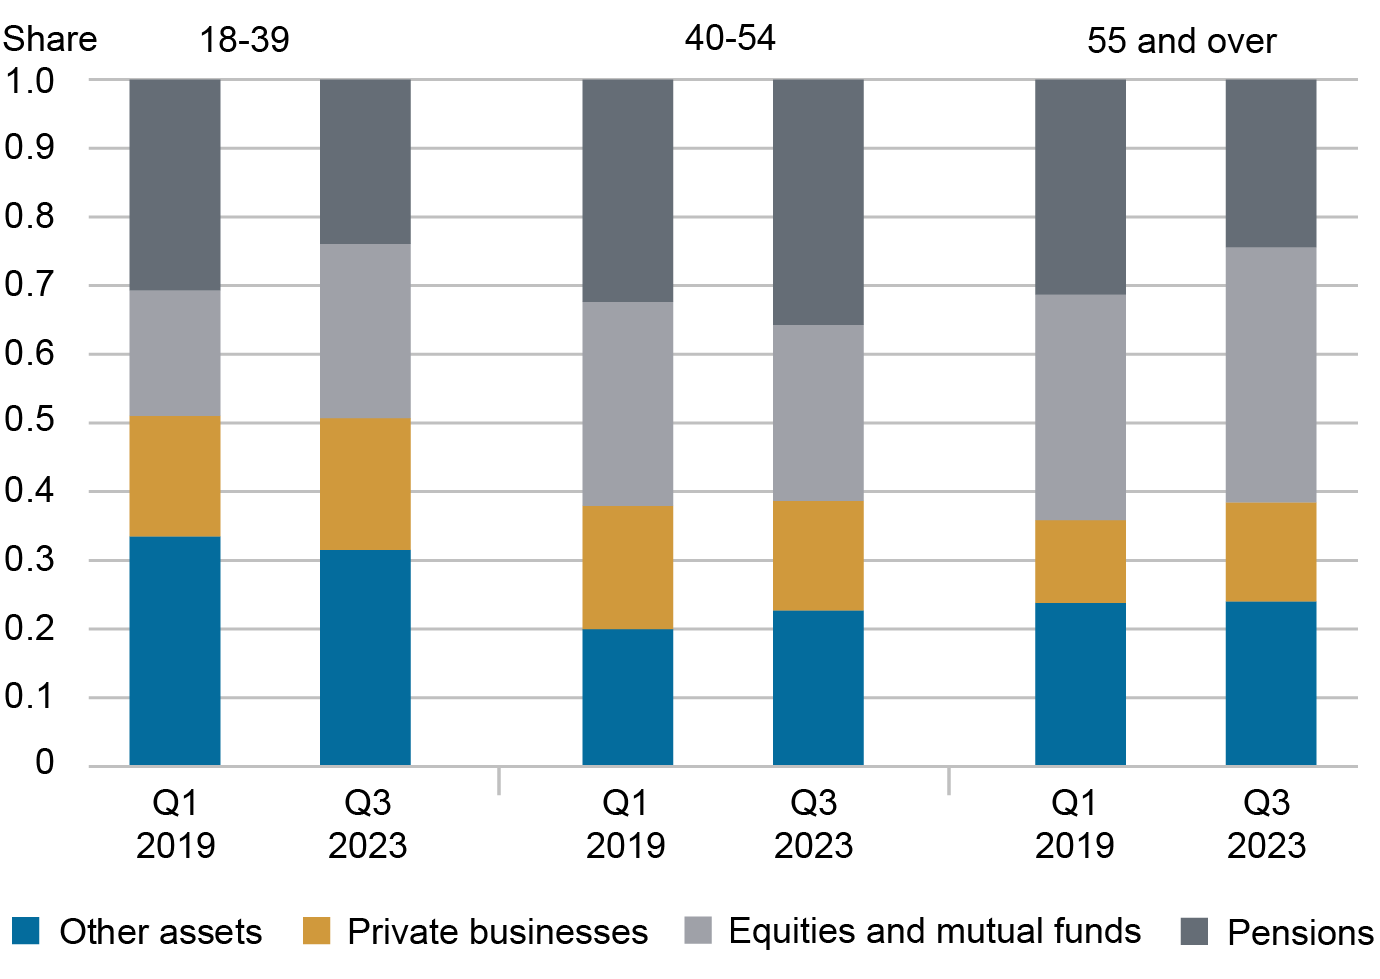
By 2023:Q3, corporate equities and mutual funds made up 37 percent of the financial assets held by those over 55, up from 33 percent in 2019:Q1. For individuals under 40, meanwhile, this share rose to 25 percent, compared to 18 percent in 2019:Q1. Thus, the over-55 group saw their equity/mutual fund portfolio share increase by 12 percent and the under-40 group’s equity share went up by a whopping 39 percent. Accordingly, the share held in pensions shrunk for both of these age groups. In contrast, 40–55-year-olds saw their equity/mutual fund portfolio share decrease from 30 to 25 percent, with their pension holdings climbing from 32 percent to 36 percent.
The under-40 group experienced a much greater increase in equity portfolio share than the older groups did; this increased exposure to equities—the fastest-growing financial asset class during the period—enabled younger adults to record higher growth in both financial assets and overall wealth. This shift in portfolio composition toward equities likely reflects the fact that younger adults, being farther away from retirement, can afford to invest in risky assets at a higher rate than older adults. The youngest age group is also the poorest and thus received much of the COVID-era fiscal stimulus, granting them excess savings to invest in equities. (It is worth noting here that our data do not allow us to separate changes in investments from changes in returns; the results we identify are a combination of both factors.)
Conclusion
The pandemic and subsequent changes in the market have had differing effects on net worth across age groups. Analyzing shifts in the distribution of wealth since 2019, we find that faster wealth growth among younger adults has led to a limited narrowing of age-based wealth disparities over the past four years. This was largely due to changes in holdings of financial assets across the three age groups, with the under-40 group shifting toward equities at the highest rate amid rising equity prices. We will continue to monitor changes in the wealth distribution as the policy and economic environment evolves.
Chart data 
Net Worth by Race and Age data
Pension data

Rajashri Chakrabarti is the head of Equitable Growth Studies in the Federal Reserve Bank of New York’s Research and Statistics Group.

Natalia Emanuel is a research economist in Equitable Growth Studies in the Federal Reserve Bank of New York’s Research and Statistics Group.

Ben Lahey is a research analyst in the Federal Reserve Bank of New York’s Research and Statistics Group.
How to cite this post:
Rajashri Chakrabarti, Natalia Emanuel, and Ben Lahey, “Wealth Inequality by Age in the Post-Pandemic Era,” Federal Reserve Bank of New York Liberty Street Economics, February 7, 2024, https://libertystreeteconomics.newyorkfed.org/2024/02/wealth-inequality-by-age-in-the-post-pandemic-era/.

Disclaimer
The views expressed in this post are those of the author(s) and do not necessarily reflect the position of the Federal Reserve Bank of New York or the Federal Reserve System. Any errors or omissions are the responsibility of the author(s).


